Tools for Quantitative Archaeology
Email:
![]()
 |
Tools for Quantitative Archaeology |
SCAT: Screen and Plotter Scatter Plots
Produces screen and publishable-quality plotter scatter plots of variables. All points may be plotted with the same symbol, or different symbols can be plotted based on the value of a variable. To run the program type SCAT<Enter>.
SEQUENCE OF PROGRAM PROMPTS
Data File {.ADF} ?
Reading ? Observations with ? Variables
? Points Read
X Variable Sequence No ?
Y Variable Sequence No ?
Classification Variable Sequence No (0 for none) ?
Name of Antana format data file with any number of variables. If there are two variables in the file, then they are taken to be X and Y coordinates, respectively. If more than 2 variables are in the input file, the program asks for the X and Y variable sequence numbers, e.g. 1 and 2. It also asks for the classification or "type" variable sequence number. Different symbols can be plotted for each type of point. Plot types are limited to the range 0-255. Any real value is truncated and the modulus (remainder) of any value greater than 255 is used. Up to 5000 points can be plotted.
Plot a File of Reference Lines and Points {N} ?
It is possible to overlay the scatter plot with a sequence of reference lines or points. The format of this file is that used by HPPLOT to plot lines and points. See the HPPLOT documentation for reference.
Plot Character [for Type ?] ?
Type the character that you wanted plotted for all, or a single "type" of point: +, *, o, and x are common choices. ASCII graphics characters may also be used. To get an ASCII graphics character hold down the <alt> key and enter a 3 digit number from the numeric pad on the keyboard. 254 is a solid square, 249 is a solid dot.
Plot to HPGL Plotter or HP LaserJet Printer {N} ?
HPGL Output to (PRN, COM1, COM2 or <filename>) ?
HP [L]aserJet 3/4 or Plotter Paper Size: [A] 8.5x11 [B] 11x17 {L} ?
Enter Y to the first question to produce a hard-copy plot. If Y is entered, the program prompts for the file or device name, either a regular file name, PRN, COM1 or COM2, depending on what port the printer or plotter is connected to. If you're using a HP Laserjet III or above printer reply PRN. If you're going to import the file into Word Perfect or another program, reply with a file name. You then select L for HP Laserjet III (this does not work for other Laserjets) or A or B for the plotter paper size. If you will incorporate the plot into Word Perfect, enter A or B, not L; the paper size does not matter.
Plot X Axis on a Log Scale {N} ?
X Values Range from 1.00 to 10.00
Xmin {?} ?
Xmax {?} ?
Reply Y to the first prompt in order to plot X axis on log10 scale. The program then tells you a rounded range of actual X values prompts you for the range to plot. Often a better-looking axis label will result if the range is further rounded. The program then prompts for the same information regarding the Y axis.
Axes: Equal [L]ength, Equal [S]cale, [F]it Screen, [U]ser Specified {S} ?
The program asks whether the plotted axes should be equal length (with the specified range for each), and equal scale (a unit difference is the same horizontal or vertical difference--use this for distribution maps), or to fit the screen (scale the axes to the maximum length to fit on the screen).
X Axis Title {X} ?
Y Axis Title {Y} ?
Plot Title ?
Plot All Points ?
Plot Type '?' {Y} ?
Plot Subtitle ?
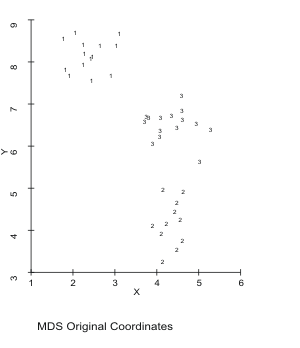
The program asks for text to label the horizontal and vertical axes, the plot (bottom centered), and subtitle, also bottom centered. If different types were specified, the program asks whether to plot all points and if not, which types to plot (as each plot type is listed enter Y to include or N to exclude a type). At this point the plot is displayed on the screen. See Figure 8 under KMEANS for a complex example; the same plot could have been produced with SCAT. Hit <Enter> to leave the plot.
Replot Data {Y} ?
If a subset of points was plotted, the program will ask if you want to replot the data.
Elapsed Time: ? Minutes
End SCAT

Sample Scat Output.
| Home | Top | Overview | Ordering | Documentation |
Page Last Updated - 22-Jul-2007