Tools for Quantitative Archaeology
Email:
![]()
 |
Tools for Quantitative Archaeology |
MDSCAL: Non-metric Multidimensional Scaling
MDSCAL is supplied as an unsupported program of the Tools for Quantitative Archaeology. It is provided courtesy of Henry Harpending, University of Utah, who wrote it for his general purpose statistical package, Antana package. MDSCAL is copyright (c) 1984 by Henry Harpending and Alan Rogers. The input and output procedures have been modified for inclusion in the Tools, but the computational algorithm remains unchanged. The current version will fit up to 3 dimensions on up to 70 observations. If MDSLGE is included, it will fit 88 cases on two or fewer dimensions.
Algorithm
Non-metric multidimensional scaling, following directly Kruskal, 1964, Psychometrika vol. 29, pp. 1-29 [verbal description] and pp. 117-129. This version follows the Kruskal paper as closely as possible, even using the same notation. Euclidean distances are used here to calculate dist, but this is easily changed. This version also uses the primary approach to ties described in the first paper above.
Preparing the Distance Matrix
First you must create a distance matrix (the MDSCAL program only deals with distances, not similarities) using the DIST program. Euclidean distance is often a good choice. (On counts, you may wish to use the ADFUTIL program to calculate percents and then transformation them, e.g., by logging them before you use DIST.) If you use Brainerd Robinson or another similarity matrix be sure to have DIST output distances. There is no need to convert distances to a 0-1 scale (but it doesn't hurt).
If you want to create a separate distance matrix the program expects an upper triangular matrix enter from left to right and top to bottom, without the diagonal, preceded by a header with an Antana header with 0 variables. (If your cases are really variables, they are cases as far as MDSCAL is concerned. Comments may be enclosed in #'s as in other Antana Format files. Note that a triangular matrix with n cases will have n*(n-1)/2 coefficients. An example with 6 cases is presented below:
# Distance Matrix of Euclidean Distance (Raw Data) Coefficients  #
6 #Observations# 0 #Variables; 15 Coefficients; Upper Triangular Form #
 2.00000 4.00001 2.23607 3.60555 4.47214 2.00000 2.23607 2.23607 4.00000
 3.60555 2.23604 4.47218 2.00000 2.23607 2.23607
Running MDSCAL
C>MDSCAL
Input Data File {.DST} ?.dst
Distance matrix with Antana header, in upper triangular form without diagonal coefficients.
Read Case Label File {N} ? Y
Case Label File Name {.ARL} ?
Optional case label for printed output.
Read a Tabulation Variable (for the plot) {N} ? Y
File With Numeric Row ID {.ATV} ?
This file is optional. It inserts an ID number for plotting the output, but has no effect on computation.
How many dimensions should be fit {2} ?
This version will fit no more than 3 dimensions.
Output File Name {.MDS} ?
This is file contains the printed listing. Enter CON to have the output go to the screen.
Random Generator Seed (0 to set from clock) {0} ?
You would enter a number only to be able to exactly reproduce a run.
The program then begins to run:
Iteration       Stress       Mag of Gradient     Alpha    -program now
       1         0.4466          0.0097          0.2600   -steps through
       2         0.3940          0.0042          0.1893   -iterations
...
      20         0.1414          0.0078          0.0717

[E]nd, [M]ore iterations, [P]erturb the step size ?       -perturb gets
...                                                       -you away from
      90         0.1196          0.0009          0.0000   -local minima
[E]nd, [M]ore iterations, [P]erturb the step size ? E
Perturb tries to get you away from local minima, M says try to reduce stress more, E you're done with the iterations, do the final output.
Output Final Distances and Monotone Regression {N} ? N
You'll usually not need this.
Write a copy of the coordinates to a file {Y} ? Y
File Name {.LOC} ?
You'll need this file to plot the results.
Plotting the Output
You can do scatter plots of the observations against any pair of dimensions. You can create the plots using SCAT directly on the .LOC file (using a PC with a graphics monitor). If you've used the .ATV file above, Scat will allow you to individually label the points so you don't have to label them on the plot. For most prompts, the default (Enter) will be fine.
SAMPLE RUN
C> SCAT
Data File {.ADF} ? ?.loc
+-------------------------------------------------------
¦   0.2734   -0.3634     4   1 #HeshodaYalaw#            -this is the format
¦  -1.1134   -0.7276     8   2 #Chalo:wa    #            -of the LOC file
+-------------------------------------------------------
X Variable Sequence No {1} ?
Y Variable Sequence No {2} ?
Classification Variable Sequence No (0 for none) {3} ?
Plot a File of Reference Lines and Points {N} ? N
Plot Character for Type 4 {A} ? 4                        -assign sites letters
Plot Character for Type 8 {B} ? C
...
Create a Plot for a HPGL Plotter {N} ? N
Plot X Axis on a Log Scale {N} ? N
  X Values Range from    -1.45 to     1.13
  Xmin {-2} ?
  Xmax {2} ?
Plot Y Axis on a Log Scale {N} ? N
  Y Values Range from    -0.82 to     0.88
  Ymin {-1} ?
  Ymax {1} ?
Axes: Equal [L]ength, Equal [S]cale, [F]it Screen, [U]ser Specified {S} ?
X Axis Title {X} ? D1
Y Axis Title {Y} ? D2
Plot Title ? PIV Sites - Logged %
Plot All Points {Y} ?
Plot Subtitle ?
At this point you get a high resolution (if that's the kind of screen you have) plot. Use <Prt Scr> to get a hard copy. Or, you can use the plotter options at the beginning of SCAT to create a file that you can plot or read into Word Perfect.
Description of Test Data provided in Testruns.
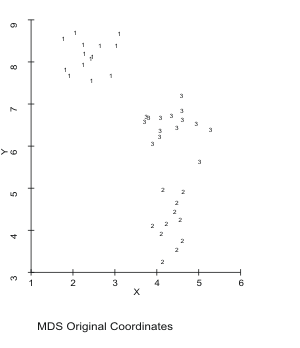
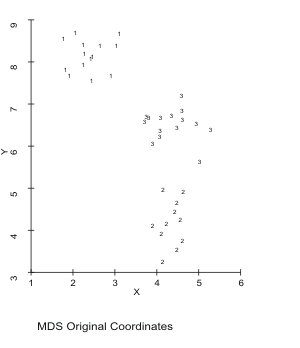
Three clusters of quasi-random data in two dimensions are provided in MDSCAL.ORI, which has the cluster ID as the third variable. You can see the clusters by plotting MDSCAL.ORI using the third column as an ID. MDSCAL.DST, the distance matrix was created by DIST with Euclidean distance, Antana format from MDSCAL.ADF, which is the first two columns of MDSCAL.ORI (the third column could be deleted with ADFUTIL). MDSCAL was run on MDSCAL.DST using MDSCAL.ATV as the tabulation (cluster ID) variable. MDSCAL.LOC is the output MDS coordinates that can be plotted (like MDSCAL.ORI). You can see, at a minimum that MDSCAL has recreated the three clusters. The output of MDSCAL is in MDSCAL.MDS.
 Figure 15. MDS Plot of Sample 2-D Data.
 Figure 16. Sample Data Scaled in 2
Dimensions.
| Home | Top | Overview | Ordering | Documentation |
Page Last Updated - 02-Jun-2007