TFQA: Tools for Quantitative Archaeology
kintigh@tfqa.com +1 (505)
395-7979
TFQA Home
TFQA Documentation
TFQA Orders
Kintigh
(ASU Directory)
 |
TFQA: Tools for Quantitative Archaeology |
TFQA Home |
FORD: Plot a Ford (Battleship Curve) DiagramThis program reads a file of percents of types (columns) by provenience (rows) and plots a publishable quality battleship curve diagram (made famous by James A. Ford) on the screen and optionally to a hard copy device. Rows and columns can be labeled. The program permits interactive elimination or reordering of the rows and columns and subsequent replotting of the data. Plots (illustrated below) can be printed via Word Perfect on nearly any printer, can be plotted directly on any Hewlett-Packard compatible plotter or a Laserjet III (or above) printer. You will need to run this program under DOSBOX as described in Running Graphics Programs under Windows. The current input limits are 48 rows (cases) and 32 variables (columns), reflecting the practical limits of plotting information on a single page. However, plots with more than about 25 rows and 15 columns may appear cramped. Input data are assumed to be in .ADF format (see the documentation on Data Files under Program Conventions). The values are assumed to be percents (not proportions), however, the program does not verify that the numbers are percents nor does it check to make sure that all percents in a row add up to 100. Optional row and column labels are read from .ARL and .ACL files, respectively, and are printed in their entirety (to a maximum length of 20 characters). However, space used to plot the labels cannot be used to plot data so it may be advantageous to abbreviate the labels. FORD also accepts input files in MVSP format (see the Program Conventions Section of this manual). The program displays a plot and then asks whether you would like to eliminate or reorder rows or columns (or both). If so, you are prompted for the new orders (the last order is the default) and the program plots a new diagram. By reducing the number of variables, the widths of the remaining bars are expanded. This cycle may be repeated as often as desired. SAMPLE RUN Data File {.ADF} ? ford
Note: Input Data Assumed to be Percents
Provenience Label File Name ("nul" to omit) {FORD.ARL} ?
Type Label File Name ("nul" to omit) {FORD.ACL} ?
Title to Appear on Plot ? Selected Zuni Area Pueblo IV Sites
Create a Plot for a HPGL Plotter {N} ? Y
HPGL Output to (COM1, COM2, PRN or

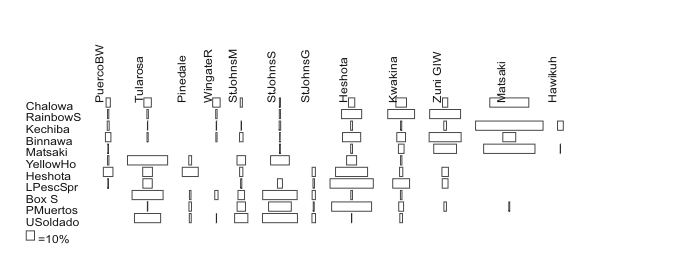
Figure 13. Original data with all cases and all variable in the original order. Select or Reorder Proveniences or Types {N} ? Y
Select and Reorder Displayed Proveniences {Y} ? Y
1=Chalowa 2=RainbowS 3=Kechiba 4=Binnawa
5=Matsaki 6=YellowHo 7=Heshota 8=LPescSpr
9=Box S 10=PMuertos 11=USoldado
Enter Index of Provenience (0 to end) 1 {1} ? 3
Enter Index of Provenience (0 to end) 2 {2} ? 5
Enter Index of Provenience (0 to end) 3 {3} ? 1
Enter Index of Provenience (0 to end) 4 {4} ? 4
Enter Index of Provenience (0 to end) 5 {5} ? 2
Enter Index of Provenience (0 to end) 6 {6} ? 8
Enter Index of Provenience (0 to end) 7 {7} ? 7
Enter Index of Provenience (0 to end) 8 {8} ? 10
Enter Index of Provenience (0 to end) 9 {9} ? 6
Enter Index of Provenience (0 to end) 10 {10} ? 9
Enter Index of Provenience (0 to end) 11 {11} ?
Select or Reorder Displayed Types {Y} ? N
Create Plotter File {N} ?Y

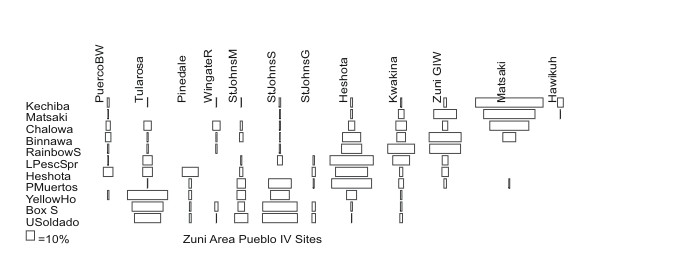
Figure 14. Plot with selected cases and variables in specified order. SAMPLE DATA FILES FORD.ADF #Cases# 11 #Vars# 12 #truncated percentages# # 8 Chalo:wa # 5 8 0 8 2 1 0 7 12 6 46 0 # 11 Rainbow Spring# 1 1 0 1 0 1 0 24 32 37 0 0 # 13 Kechiba:wa # 2 0 0 0 0 1 0 2 1 3 80 6 # 33 Binna:wa # 6 1 0 1 4 0 0 21 10 38 15 0 # 48 Mats'a:kya # 0 0 0 0 0 1 0 2 6 27 61 0 # 71 Yellow House # 1 48 3 0 10 22 0 12 1 0 0 0 # 78 Heshot u/a # 11 11 19 0 3 0 3 38 3 7 0 0 # 85 Lower Pescado # 0 11 0 0 1 5 1 51 20 6 0 0 # 97 Box S Site # 0 37 1 3 7 41 3 1 1 0 0 0 #139 Pueblo Muertos # 0 0 2 0 10 27 1 47 5 2 1 0 #161 Upper Soldado # 0 31 2 0 15 42 4 0 3 0 0 0 FORD.ARL Chalowa RainbowS Kechiba Binnawa Matsaki YellowHo Heshota LPescSpr Box S PMuertos USoldado FORD.ACL PuercoBW Tularosa Pinedale WingateR StJohnsM StJohnsS StJohnsG Heshota Kwakina Zuni GlW Matsaki Hawikuh Page Last Updated: 21 June 2022 |
| Home | Top | Overview | Ordering | Documentation |