Tools for Quantitative Archaeology
Email:
![]()
 |
Tools for Quantitative Archaeology |
DIVPLT: Plot the Results of DIVERS
Program DIVPLT creates screen and hard-copy graphical plots of the results produced by program DIVERS. To run DIVPLT simply type: DIVPLT<Enter> or DIVPLT <Filename><Enter>. You can produce either screen or plotter plots or both, on the same run. Alternately, plots can be incorporated into Word Perfect documents (see the section "HARDWARE SUPPORT" under "Program Conventions" above). Because this program runs very quickly, you should preview program results on the screen before plotting them (which takes a little while, because the plotter is slow).
SEQUENCE OF DIVPLT PROGRAM PROMPTS
Plot File Produced by DIVERS {.PLT} ?
Conkey: Lower Magdalenian Designs - 1/7/1986
After the program greeting message you are prompted for the plot output file produced by DIVERS version 3.1. Enter the file name of that file. The program assumes that the file extension is .PLT, so "DIVERS3A" and "DIVERS3A.PLT" have exactly the same effect. (If the plot file name has no extension, e.g. "PLOT", enter a period after the file name: "PLOT.".) The program will respond with the title line and date of that run of the DIVERS program (assuming that the calendar was properly set). If this is incorrect, hit <Ctrl>Break and start again with the program.
Plot to HPGL Plotter or HP LaserJet Printer {N} ?
HPGL Output to (PRN, COM1, COM2 or <filename>) ?
HP [L]aserJet 3/4 or Plotter Paper Size: [A] 8.5x11 [B] 11x17 {L} ?
Enter Y to the first question to produce a hard-copy plot. If Y is entered, the program prompts for the file or device name, either a regular file name, PRN, COM1 or COM2, depending on what port the printer or plotter is connected to. If you're using a HP Laserjet III or above printer reply PRN. If you're going to import the file into Word Perfect or another program, reply with a file name. You then select L for HP Laserjet III (this does not work for other Laserjets) or A or B for the plotter paper size. If you will incorporate the plot into Word Perfect, enter A or B, not L; the paper size does not matter.
Bar Chart of Category Proportions:
0=none
1=sorted plot with cumulative percentages
2=sorted plot without cumulative percentages
3=unsorted plot with cumulative percentages
4=unsorted plot without cumulative percentages
Bar Chart Option {2} ?
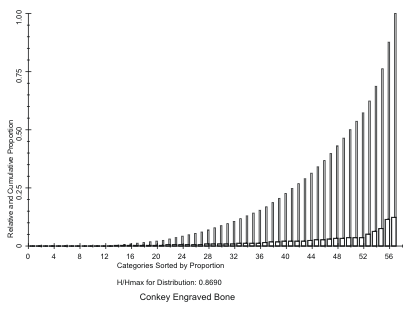
 Figure 10. DIVPLT Bar Chart of Proportions of
Elements.
A reply other than 0 to this prompt will display a bar chart of the DIVERS category proportions, as indicated (Figure 10).
Produce a Pen Plot {N}
If you have indicated that you wish to make plotter plots, you will see this prompt, before any of the possible displays are plotted.
Plot Richness vs. Sample Size for Actual and Simulated Samples {Y} ?
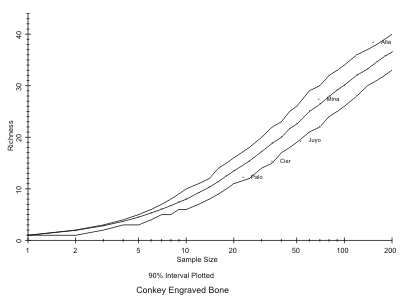
 Figure 11. DIVERS Monte Carlo Analysis of
Conkey's Upper Paleolithic Engraved Bone. DIVPLT.
This prompts asks whether you want a plot of richness versus sample size (Figure 11). The mean and confidence interval of the sample sizes at which trials were run are plotted. The sample sizes run are indicated by a '+'. The mean diversity is plotted with a solid line between the computed points, and the confidence interval specified (noted in the first title line) is plotted with dashed lines. The actual data points are plotted so that their plot symbols are centered over the actual diversity value and the plot label is printed to the right of the symbol.
Plot Sample Size Axis on Log Scale {Y} ?
A positive response to this prompt will scale the sample size axis on a log scale, which generally makes it more readable. You can experiment to see whether you like the linear or log scale best.
Plot Diversity Axis on Log Scale {N} ?
A positive response to this prompt will scale the diversity (richness or evenness) axis on a log scale. In general this is not advantageous, but it may make the richness plot more readable.
Plot Min and Max along with Confidence Interval {N} ?
A positive response to this prompt will produce a dotted line on the plot indicating the minimum and maximum diversity obtained in the trials. Users are warned that this may be misleading if unless a relatively large number of trials are run, since the more trials are run, the larger will be the spread of the minimum and maximum.
Plot Richness vs. Sample Size for Actual Samples Alone {N} ?
y A positive response to this prompt will produce a plot with only the data points plotted on the axes, without the simulated samples. This may be useful for presentation, but has no information not contained on the previous plot.
Plot Evenness vs. Sample Size for Actual and Simulated Samples {Y} ?
Plot Sample Size Axis on Log Scale {Y} ?
Plot Diversity Axis on Log Scale {N} ?
Plot Min and Max along with Confidence Interval {Y} ?
Plot Evenness vs. Sample Size for Actual Samples Alone {N} ?
These prompts are used to produce plots of evenness like the richness plots described above.
Plot of Richness/Evenness Sample Legend {Y} ?
Another Copy of Legend {N} ?
If desired, one or more copies of a plot legend may be plotted. To produce publication quality plots you will want to experiment with the labeling options described with the diversity program. It may be useful to have only a plot symbol and no plot label, and to use the legend either on the side, or cut up and glued on the plot (as was done in the American Antiquity article). Plot symbols but no plot labels are obtained using point data label input to DIVERS like: "A/Altamira"
Elapsed Time: 10.20 Minutes
End DIVPLT
These are the program closing messages.
NOTES ON THE DIVERS PLOT FILE
Note that the DIVERS output plot file can be edited to enhance the aesthetics of the plot labeling, although this must be done with care as some changes will render the file unreadable by DIVPLT. Thus, if you are concerned about saving the results of a time-consuming DIVERS run, make a copy before editing it. Notepad or any text editor that writes ASCII files can be safely used to change the point label lines, as long as the following rules are kept in mind. Each point label line looks like:
X:Alta/ALTAMIRA
The first character is the plot symbol. The colon is ignored, and everything between the : and the / is the plot label, which is placed on the plot next to the symbol. Everything following the / is the legend label. The plot label or the legend may be omitted, however the plot symbol and : must always be provided. Thus the following are all legitimate:
+:
1:/Altamira
>A:Altamira
*: Altamira/Altamira Lower Magdalenian Levels
The final example will separate the plot label from the plot symbol. This behavior is unlike DIVERS where leading blanks are ignored.
If after editing, when you run the DIVPLT program you get an error message, you have somehow destroyed a critical aspect of the formatting. You will probably have to start again.
| Home | Top | Overview | Ordering | Documentation |
Page Last Updated - 02-Jun-2007