TFQA: Tools for Quantitative Archaeology
kintigh@tfqa.com +1 (505)
395-7979
TFQA Home
TFQA Documentation
TFQA Orders
Kintigh(ASU
Directory)
 |
TFQA: Tools for Quantitative Archaeology |
TFQA Home |
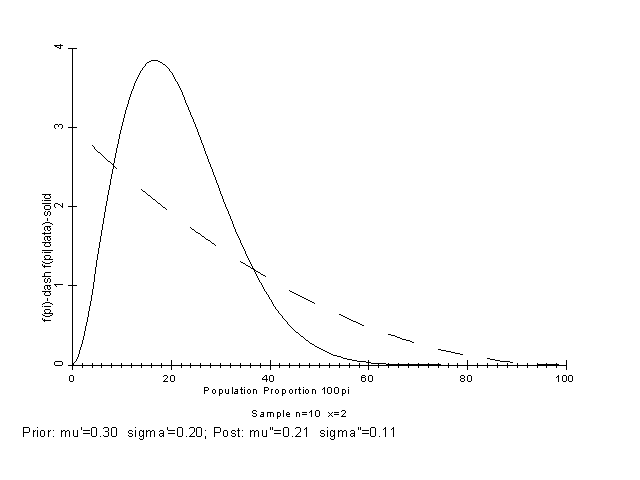
BAYES: Bayesian Methods for ProportionsBAYES, while not currently supported or thoroughly documented, is included in the TFQA package for those interested. The program implements Bayesian methods for proportions as described by Iversen (1984). The notation used in prompts and in output follows Iversen. Intervals are calculated and graphed for Bayesian estimates of proportions based on both flat (uninformative) and informative priors. Informative priors can be described by their mean and standard deviation of a Beta distribution. Iversen, Gudmund R.1984 Bayesian Statistical Inference, Quantitative Applications in the Social Sciences 43, Sage University Papers, Beverly Hills, California.  Figure 12. Plot of Bayesian Prior and Posterior Probabilities. PROGRAM EXAMPLE Output File Name {CON} ?
Create a Plot for a HPGL Plotter {N} ?
Bayesian Estimates for Proportions
[I]nformative or [F]lat Prior {F} ? I
Prior Beta Distribution µ { 0.000} ? .3
Prior Beta Distribution s { 0.000} ? .2
Sample n {0} ? 10
Sample x {0} ? 2
Sample n = 10 Sample x = 2
Prior a' = 1 Prior b' = 3 C' = 3.000E+00
Post a" = 3 Post b" = 11 C" = 8.580E+02
Prior µ' = 0.300 Prior s' = 0.200
Post µ" = 0.214 Post s" = 0.106
Print Bayesian Probability Intervals {Y} ? Y
Resolution of p (.001 - .01) {0.010} ?
Bayesian Probability Intervals
100%
Tail Interval
---------------- ------------------------------------------
Level p0 P(p<=p0) p1 p2 P(p1<=p<=p2) f(p1) f(p2)
0.01 0.040 0.014 0.170 0.180 0.038 3.847 3.821
0.05 0.070 0.058 0.160 0.180 0.077 3.842 3.821
0.10 0.090 0.105 0.150 0.180 0.115 3.801 3.821
0.20 0.130 0.234 0.140 0.200 0.228 3.722 3.685
0.25 0.140 0.270 0.130 0.200 0.265 3.602 3.685
0.50 0.210 0.535 0.100 0.240 0.503 2.992 3.177
0.75 0.280 0.751 0.070 0.310 0.761 2.035 2.017
0.80 0.310 0.819 0.060 0.330 0.816 1.664 1.703
0.90 0.360 0.900 0.040 0.380 0.910 0.913 1.040
0.95 0.420 0.957 0.030 0.430 0.957 0.569 0.574
0.99 0.510 0.991 0.000 0.990 1.000 0.000 0.000
Display Plot {Y} ?
Program End
|
| Home | Top | Overview | Ordering | Documentation |
| Page Updated: 13 October 2025 |